
October Marks First Non-Record Month of 2025, Yet Activity Remains Elevated.
Median prices in October
Apartments
AED 1,261,650
Townhouses
AED 3,182,888
Villas
AED 9,590,000
Price growth cools to +0.13%, but long-term uptrend remains firmly intact
19,760 sales in October—the first YOY dip of 2025, but still the second-strongest October on record
Off-plan dominates, holding an adjusted 70.6% market share despite a monthly pullback
New project launches surge, with over 131,500 units introduced YTD, far exceeding a typical full year
Mortgage activity rebounds +28.9%, reflecting the impact of the recent rate cut and renewed bulk financing
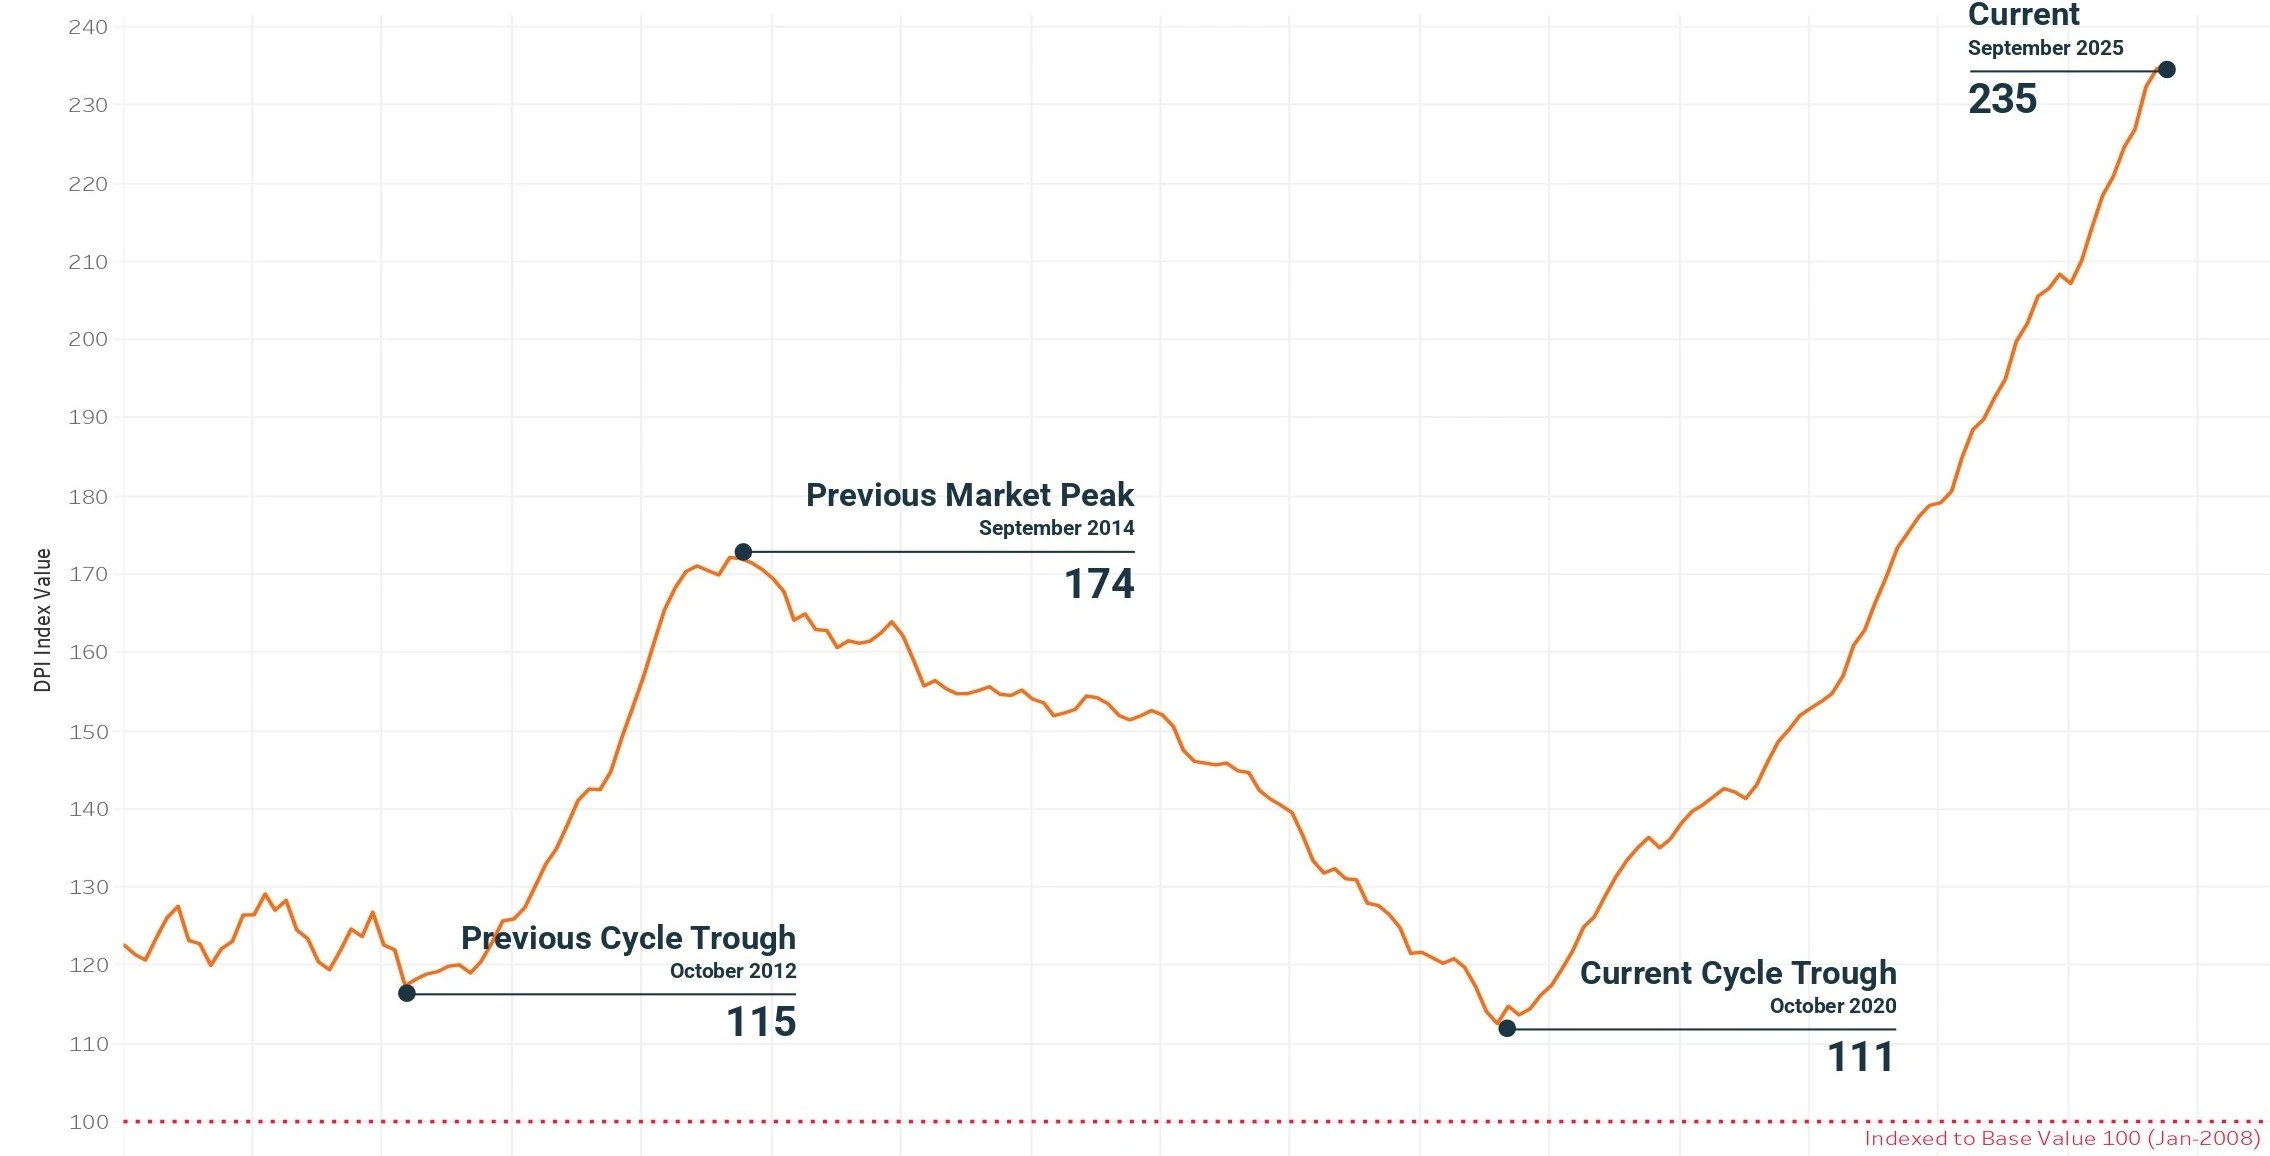
Momentum in Dubai's residential real estate market carried through October, though with noticeably softer monthly gains. Prices edged up by just 0.13%, easing back from the more pronounced increases seen in September and August. Even with this slower pace, the market continues to climb steadily. The Property Monitor Dynamic Price Index (DPI) places average prices at AED 1,683 per square foot—more than double their level at the October 2020 low point and comfortably above the previous market high set in 2014. The market's long-term upward trend remains intact, even as monthly movements become more tempered.
A total of 19,760 sales transactions were recorded in October, a decline of 2.7% month-on-month and 4.9% year-on-year—the first annual decrease seen this year. Although October was also the first calendar month of 2025 not to set a new all-time high, activity remained near historic levels. It stands as the second-strongest October ever, surpassed only by October 2024, which still holds the highest monthly total in Dubai's transaction history. The slight year-on-year decline therefore reflects the exceptionally elevated baseline set last year and may simply be a function of comparison rather than...
SNAPSHOT
October 2025
+0.13%
Dynamic Price Index
Monthly Change
AED 1,683/sq ft
Dynamic Price Index
Current Property Price
19,760
Number of Monthly
Transactions
AED 220M
Highest Recorded Sale
5 Bedroom Villa
Rosewood Residences Dubai,
Dubai Peninsula
AED 153K
Lowest Recorded Sale
Studio Apartment
Building U-13, Italy Cluster,
International City
Property Monitor Dynamic Price Index
+0.13%
MoM Change
+3.56%
QoQ Change
+14.29%
YoY Change
AED 1,683
Price Per Sq Ft
DPI Monthly Overview
| Month | Index Value | MoM Change | QoQ Change | YoY Change | Index Price (AED/sq ft) |
|---|---|---|---|---|---|
| Oct 2025 | 235.03 | 0.13% | 3.56% | 14.29% | 1,683 |
| Sep 2025 | 234.73 | 1.00% | 4.45% | 16.12% | 1,681 |
| Aug 2025 | 232.40 | 2.40% | 5.19% | 16.28% | 1,664 |
| July 2025 | 226.96 | 0.99% | 3.86% | 16.37% | 1,625 |
| June 2025 | 224.73 | 1.71% | 4.87% | 16.63% | 1,609 |
| May 2025 | 220.95 | 1.11% | 5.12% | 16.34% | 1,582 |
| April 2025 | 218.52 | 1.97% | 5.43% | 15.86% | 1,565 |
| Mar 2025 | 214.29 | 1.95% | 2.80% | 15.83% | 1,535 |
| Feb 2025 | 210.18 | 1.41% | 1.72% | 16.31% | 1,505 |
| Jan 2025 | 207.26 | -0.57% | 0.79% | 15.64% | 1,484 |
| Dec 2024 | 208.45 | 0.88% | 3.12% | 16.52% | 1,493 |
| Nov 2024 | 206.63 | 0.48% | 3.39% | 16.42% | 1,480 |
| Oct 2024 | 205.64 | 1.73% | 5.44% | 17.22% | 1,473 |
Residential market performance
Apartment price performance (Q4 2025)
transacted price (AED psf)
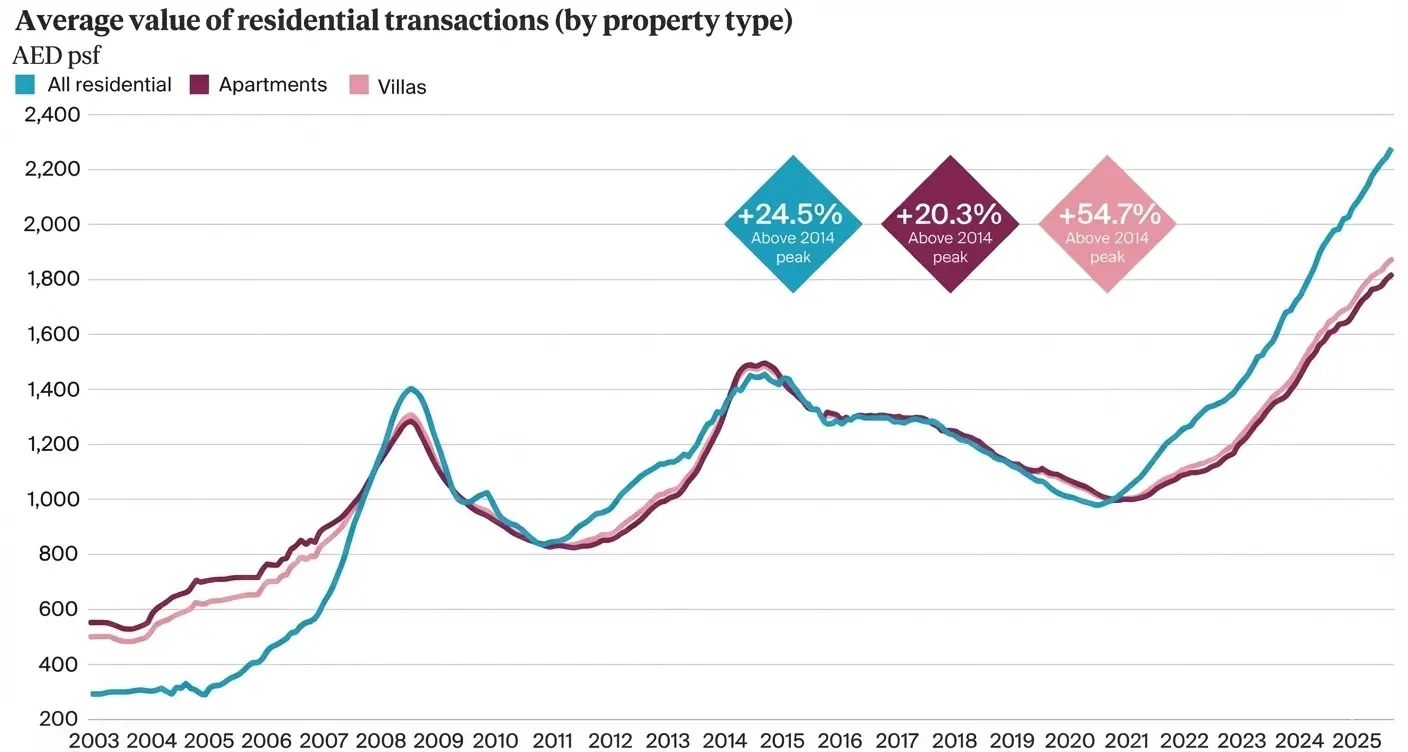
Villas: limited supply fuels record gains
Dubai's villa market continued to outperform apartments in both pace and magnitude of price appreciation. During Q3 2025, villa prices rose by an average of 3.6% q/q, leaving them 12% higher than this time last year. This was supported by a chronic undersupply of completed homes and a growing cohort of high-income residents seeking larger family-oriented spaces.
On an annual basis however, luxury communities were once again at the forefront of price gains. For instance, La Mer, which we have recently identified as a prime neighbourhood experienced the sharpest increase at 33.8% q/q and 54.7% y/y -the highest level for any villa community in the city. While Palm Jumeirah, which has been at the epicenter of luxury home sales during this cycle experienced no price movement during Q3, alongside a 19% reduction in the number of transactions, suggesting more homes are being secured for the long-term. Prices here currently stand at AED 6,764 psf (US$ 1,840 psf).
Family-oriented suburbs such as Arabian Ranches (34.2%), Jumeirah Islands (27.5%), and Emirates Hills (33.6%) also recorded strong appreciation over the last 12 months, highlighting continued end-user demand for luxury homes.
A similar story appears to be playing out in more peripheral locations, with Expo City and Dubai South, for example, also experiencing quarterly declines amid high supply volumes. At Expo City for instance, over 800 homes are expected to be handed over by Q3 2028, while in Dubai South, we recorded a further 4,467 residential completions by Q3 2029, effectively doubling supply in the community. A high number of home handovers in a community usually precedes price moderation, which appears to have been the case in these areas.
Overall, villa values have now climbed approximately 124% since Q1 2020 and stand 55% above the 2014 peak with current average prices at AED 2,250 psf.
Villa price performance (Q4 2025)
transacted price (AED psf)
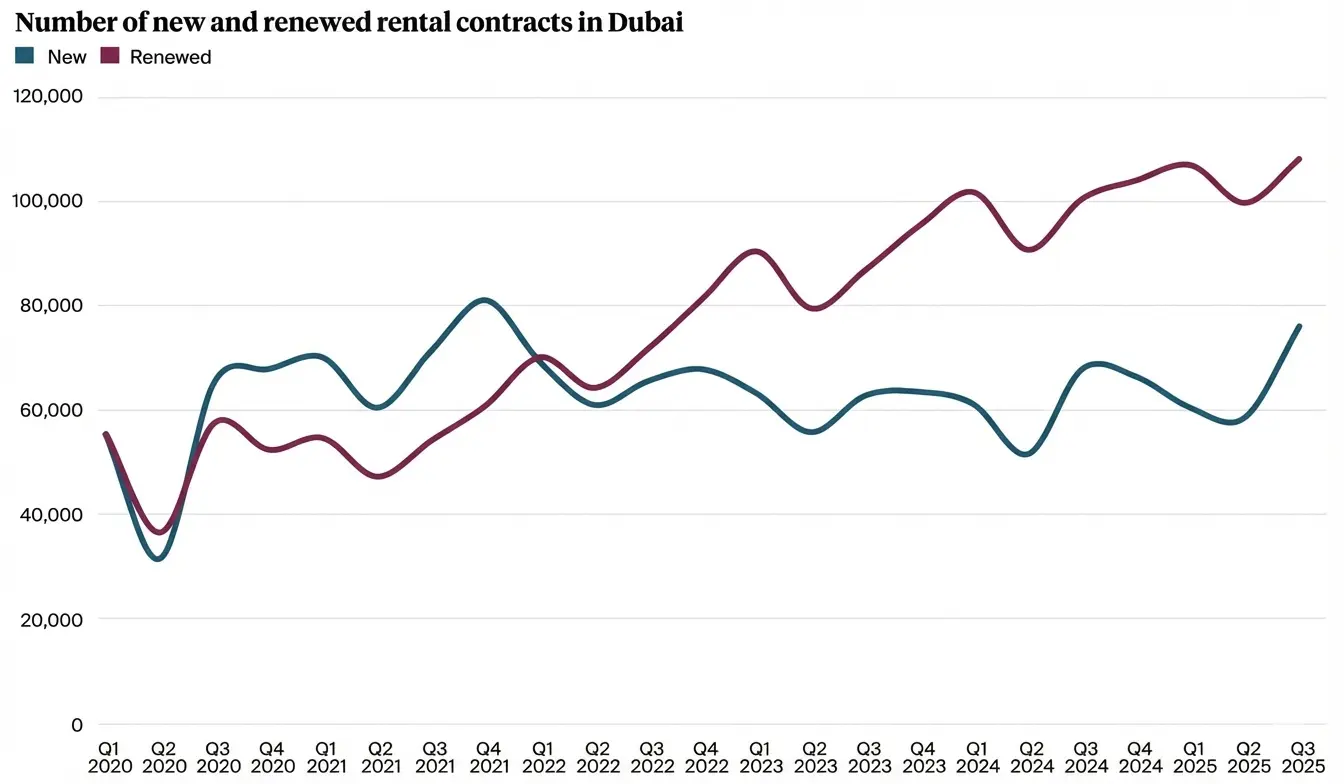
THE RENTAL MARKET
Rents up 5.5% in 12 months
Away from the sales market, average citywide rents have risen 5.5% over the last 12 months and currently stand at AED 70,000 per annum. This represents a rise of 45.5% since Q1 2021, which leaves average rents across the city 16.1% above their 2014 peak.
Rents for villas have advanced 5.6% in the twelve months to the end of Q3 2025 and currently average AED 193,000 p.a. for new contracts. The median annual rent for a three-bedroom villa stands at AED 165,000 (US$ 45,000), compared with AED 145,000 a year earlier. Al Barari (+29%), Jumeirah Islands (+26.5%), and Palm Jumeirah (+24%) were among the top-performing villa communities.
Apartment lease rates are up by 5.4% over the last 12 months and currently average AED 65,000 p.a. for new contracts, leaving them 13.1% above the 2014 peak. A typical two-bedroom apartment now commands AED 70,000-75,000 p.a. (c. AED 700-900 psf p.a.), while rents in more prime locations such as Jumeirah and Downtown exceed AED 165,000 p.a. (or c.160 psf p.a.+).
At the other end of the price spectrum, International City remains the city's most affordable submarket, averaging AED 40,000 p.a. (or around AED 61 psf p.a.).
Some established submarkets such as Arabian Ranches, Dubai Hills Estate, Jumeirah Village Circle are seeing some stability in rental rates in both apartments and villas over the last quarter.
Rental yields have compressed slightly as capital values have risen faster than lease rates. Average calculated apartment yields currently stand at 7.40%, while villas average 5.30%, for single let properties.
Capital value and rental value growth over the last five years
*Annualised to the end of Q4 2025
Demand Trends
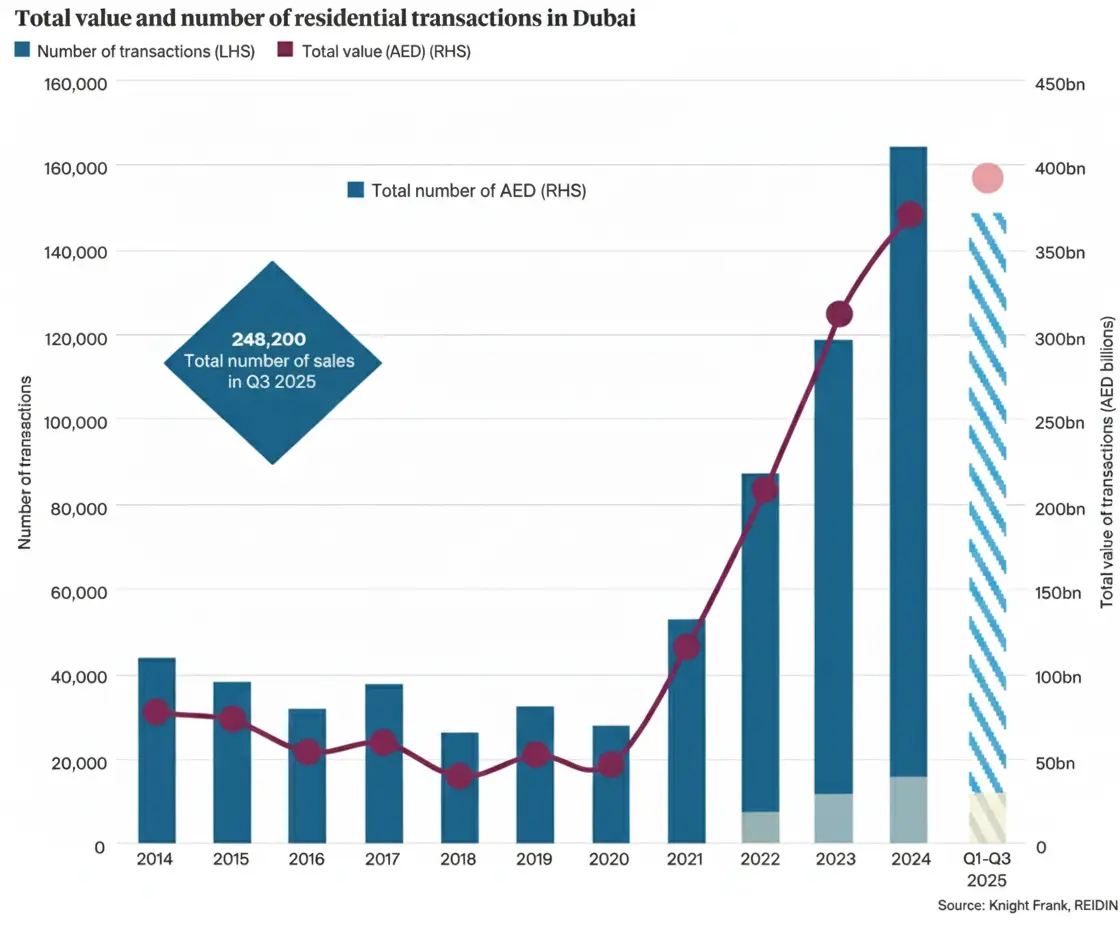
Record home sales volumes
Q3 2025 saw a record 56,854 home sales, an increase nearly 17% compared to Q3 2024. Cumulatively, over 148,000 transactions were registered between January and September 2025, with a total value of AED 401.7bn, 9.2% over the total for 2024. This builds on the AED 367bn (US$100bn) in home sales last year across 169,000 deals.
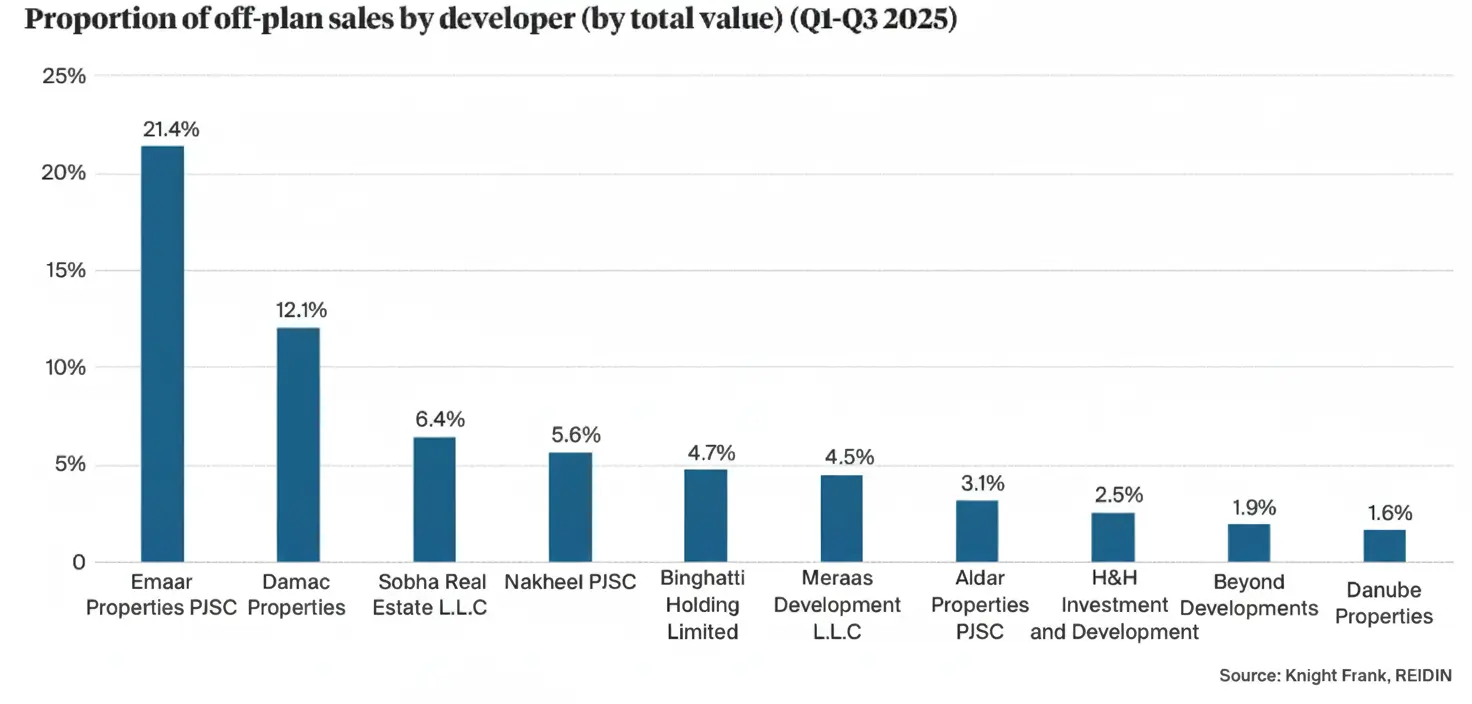
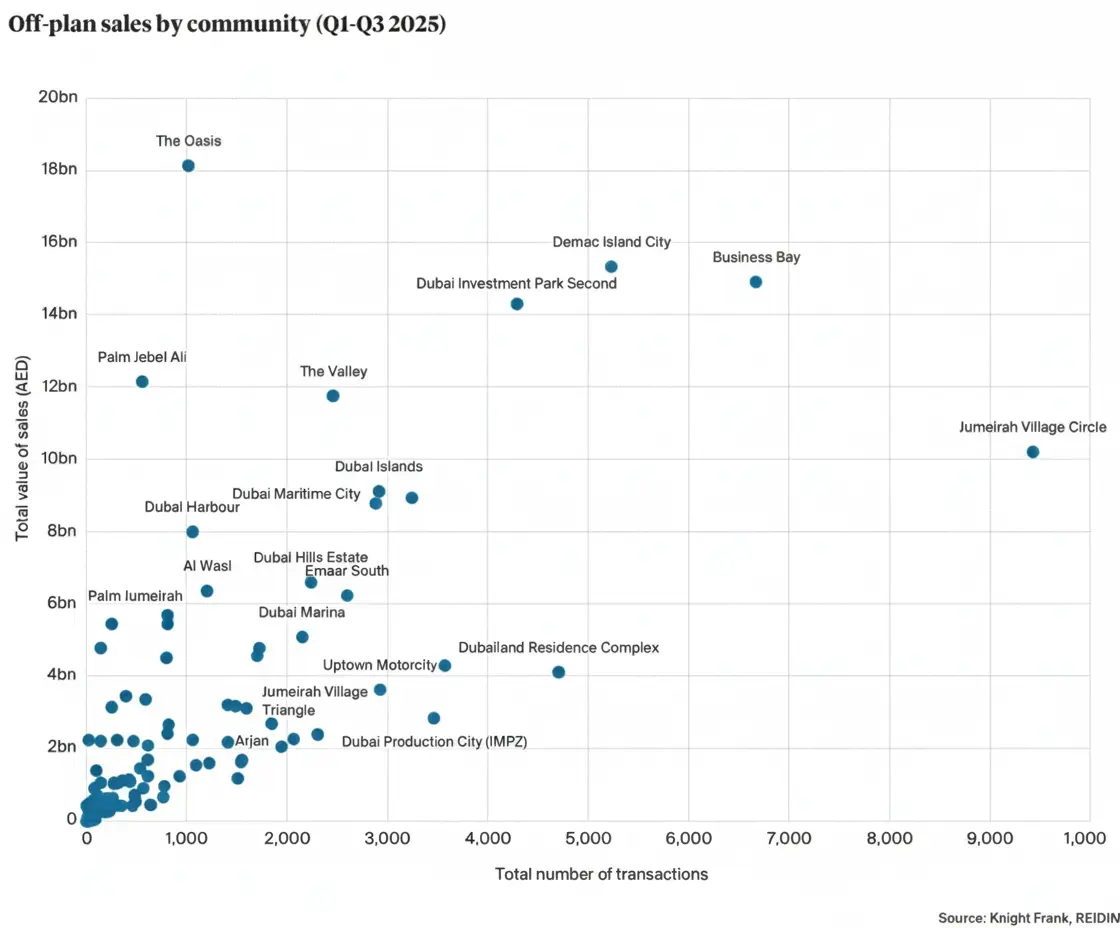
Off-plan sales dominance
Off-plan activity dominated sales, accounting for over 72% of total transaction value during Q3. Developers leading sales value in Q3 2025 were Emaar (17.6%), Damac (9.6%), and Binghatti (7.4%), which collectively represent more than 35% of all off-plan sales by value. Submarkets ranking highest in terms of transaction volumes include Jumeirah Village Circle (5,333 units), Business Bay (4,108 units) and Dubai Investment Park (3,060 units), with Business Bay also leading by total deal value at AED 8.3bn (US$ 2.3bn).
Secondary market sales triple since 2021
Meanwhile, a robust secondary market signals deep liquidity, particularly in completed family communities where transaction volumes have tripled since 2021.
PREPARING FOR THE RESIDENTIAL MARKET’S NEW PEAK

Muhammed Amanullah
Founder - Enva Properties
Dubai is firmly within its third real estate cycle, which commenced in 2020 and has now generated over five years of sustained growth. This contrasts with the two previous cycles, which lasted approximately 5.7 years and 3.8 years respectively. What sets the current cycle apart is its strong foundation of fiscal policy reforms, ongoing economic diversification, and rising foreign direct investment, all of which are driving solid population growth. Crucially, this population growth is structural rather than transient, with families increasingly choosing Dubai as a long-term home. This is reflected in private K-12 school enrolments growing faster than the overall population, which is expanding at around 5%. On the demand side, the residential market continues to demonstrate resilience, while on the supply side, new deliveries have broadly remained in line with demand. Looking ahead, the upcoming pipeline may lead to price softening in select submarkets, even as the wider market moves toward stability. This phase of moderation is expected to trigger a new wave of developer innovation—spanning architecture, sustainability, and technology—as competition intensifies to achieve sales targets and deliver fully occupied, vibrant communities.
What sets the current cycle apart is its foundation of fiscal reforms, ongoing economic diversification, and foreign direct investment, collectively supporting strong population growth.